Most conversations about British weather start with rain. The more useful question is what's happening far above the rain, and that usually comes down to pressure. Once you can picture a high and a low, the forecast stops being a row of symbols and starts reading like a story with a plot.
What pressure actually measures
Atmospheric pressure is the weight of the air above you, pressing down on everything underneath. At sea level it averages around 1013 hectopascals (hPa) — the unit you'll see on the shipping forecast, and the same as millibars on an older barometer.
Around the UK, readings usually wander between roughly 950 hPa in a deep Atlantic storm and 1050 hPa under a stubborn winter high. That band looks narrow on paper. In practice those few dozen units are the difference between a still, frosty morning and a day of sideways rain against the window.
Pressure also falls quickly as you climb. Near sea level it drops by about one hectopascal for every eight metres of height, which is why a walk up a Lakeland fell feels very different from a walk along the promenade, even when both are under the same system.
Highs and lows: two different engines
A low is simply an area where the pressure is lower than everything around it. Air converges at the surface, gets pushed upwards, cools as it rises, and its water vapour condenses into cloud. Rising air is the engine behind almost everything wet and windy in the British Isles.
A high works in the opposite direction. Air sinks from aloft, warms as it descends and dries out as it goes. Subsidence acts like a lid on the atmosphere: it suppresses cloud growth and keeps showers from getting started.
Because the UK sits beneath the jet stream — the fast ribbon of wind high above the Atlantic — we get a steady conveyor of depressions steered towards us from the west, with ridges of high pressure squeezing in between them. The weather you experience on any given Tuesday is really just your position in that shifting pattern.
How low pressure builds British rain and cloud
Depressions rarely arrive alone. They come wrapped in fronts, and the type of front explains a lot about the kind of rain you get.
- Warm front — a slow, thickening blanket of cloud that lowers through the day, followed by steady, persistent rain. If the sky turns milky then grey then threatening, this is usually why.
- Cold front — a narrower band of heavier rain that passes through in a few hours, often with a squally burst of wind, then clears to brighter skies behind it.
- Showers — the aftermath. Cold air crossing a relatively warm sea picks up moisture, builds towering cumulus, and dumps it as short, sharp downpours separated by sunshine.
This is why the day after a storm is often brighter but not drier. The rain has changed character rather than stopped.
Why high pressure doesn't guarantee sunshine
High pressure gets a good reputation, and in summer it earns it: light winds, long sunny spells, warm afternoons and a fair-weather cumulus sky. It's the classic barbecue setup.
Winter is a different matter. A winter high often brings clear, calm nights, and clear nights let heat escape freely, so frost forms quickly and valley temperatures drop hard. Moisture trapped beneath the sinking air can't mix upwards, so it lingers as fog or a low, flat sheet of grey cloud. Forecasters call it anticyclonic gloom, and it can sit over a city for days.
Under those conditions, pressure is high, winds are light and there's barely a drop of rain — and yet the day still feels bleak. Pressure tells you about the structure of the atmosphere, not the whole story.
Wind: the squeeze between the lines
Isobars are the curved lines on a pressure chart, and each one joins places with the same pressure. Their spacing matters more than their shape. Packed tightly together, they show a steep pressure gradient, and the air rushes from high to low to even things out. That's your gale. Spread far apart, the gradient is gentle and the wind is barely noticeable.
In the Northern Hemisphere, air circulates anticlockwise around a low and clockwise around a high, and it blows roughly along the isobars rather than straight across them. A handy check is Buys Ballot's law: stand with your back to the wind and low pressure is on your left. It works well enough to be genuinely useful when you're standing on a hillside trying to work out which way a front is heading.
Reading a pressure chart in five minutes
- Find yourself. Locate your region on the chart and note which isobars sit nearest to you.
- Judge the spacing. Count the isobars within a short distance. Two or three close together means a windy day ahead; one lonely line means calm.
- Identify the centres. Mark the H and L symbols. Which one is closest, and is it moving towards you or away?
- Trace the fronts. A front crossing your area means rain at roughly the time it arrives. Fronts on the far side of the country are somebody else's problem today.
- Check the trend, not just the value. A steady 1005 hPa is unremarkable. A reading falling from 1010 to 1000 in six hours means something is genuinely on the way.
Putting it to use this week
If you own a barometer, read it at the same time each day and write the number down. The value matters far less than the direction. Falling steadily through the morning usually means a front is approaching, so take the waterproof before you leave. Rising after a wet spell suggests the showers will ease and brighter air is moving in.
Pair that habit with the forecast's pressure chart rather than the temperature alone. Wind direction, sea temperature and the time of year all shape what a high or low delivers on the day, so treat pressure as the framework and the rest as detail.
And if the barometer sits high and flat for a week in January, don't expect blue skies. Expect cold, still, grey days and a hard frost after dark — and plan accordingly.
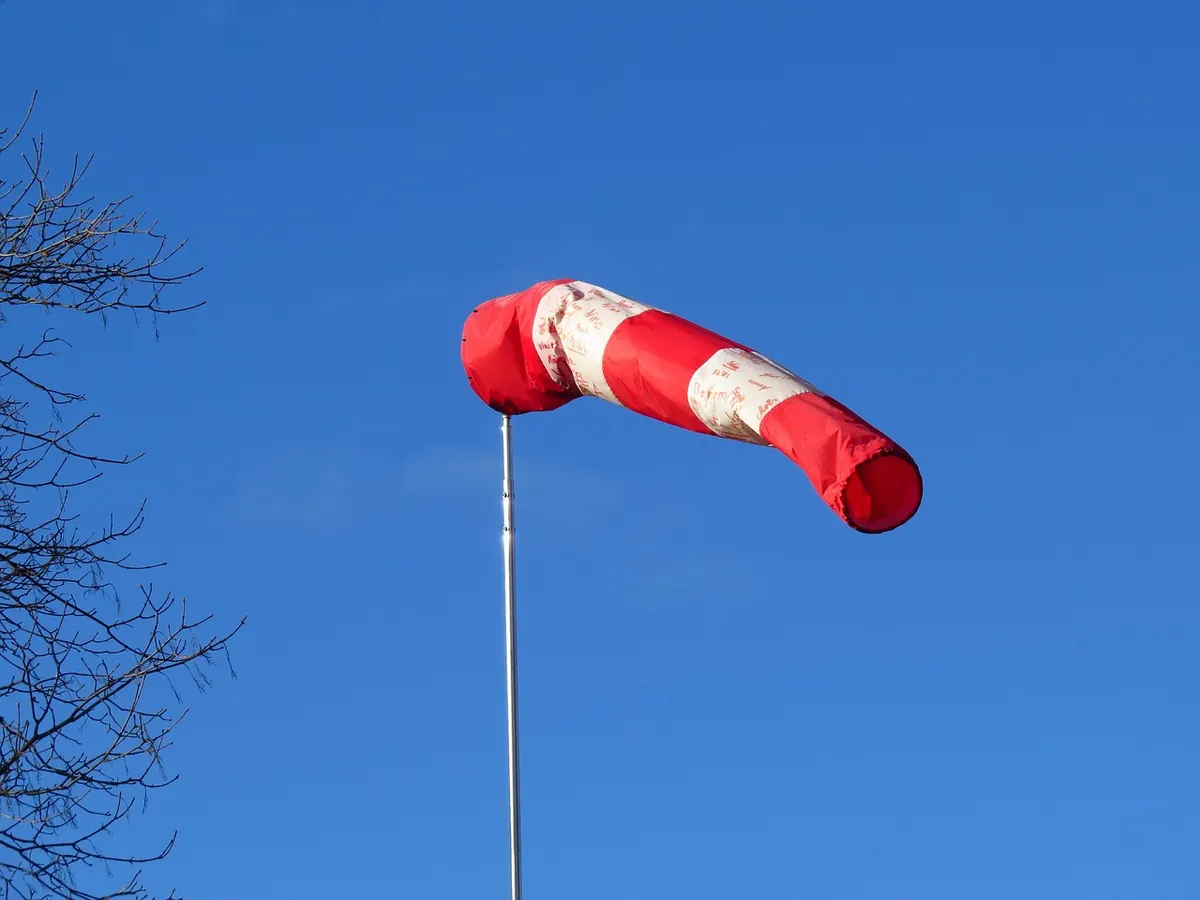
Photo: Jonathan Cooper / Pexels